
Analytics
How busy your server is, when players come, how many come back, and how quickly your staff answer reports.
On this page
Server analytics#
Open Analytics in the sidebar. The figures are worked out every hour, over the last 7, 30 or 90 days.
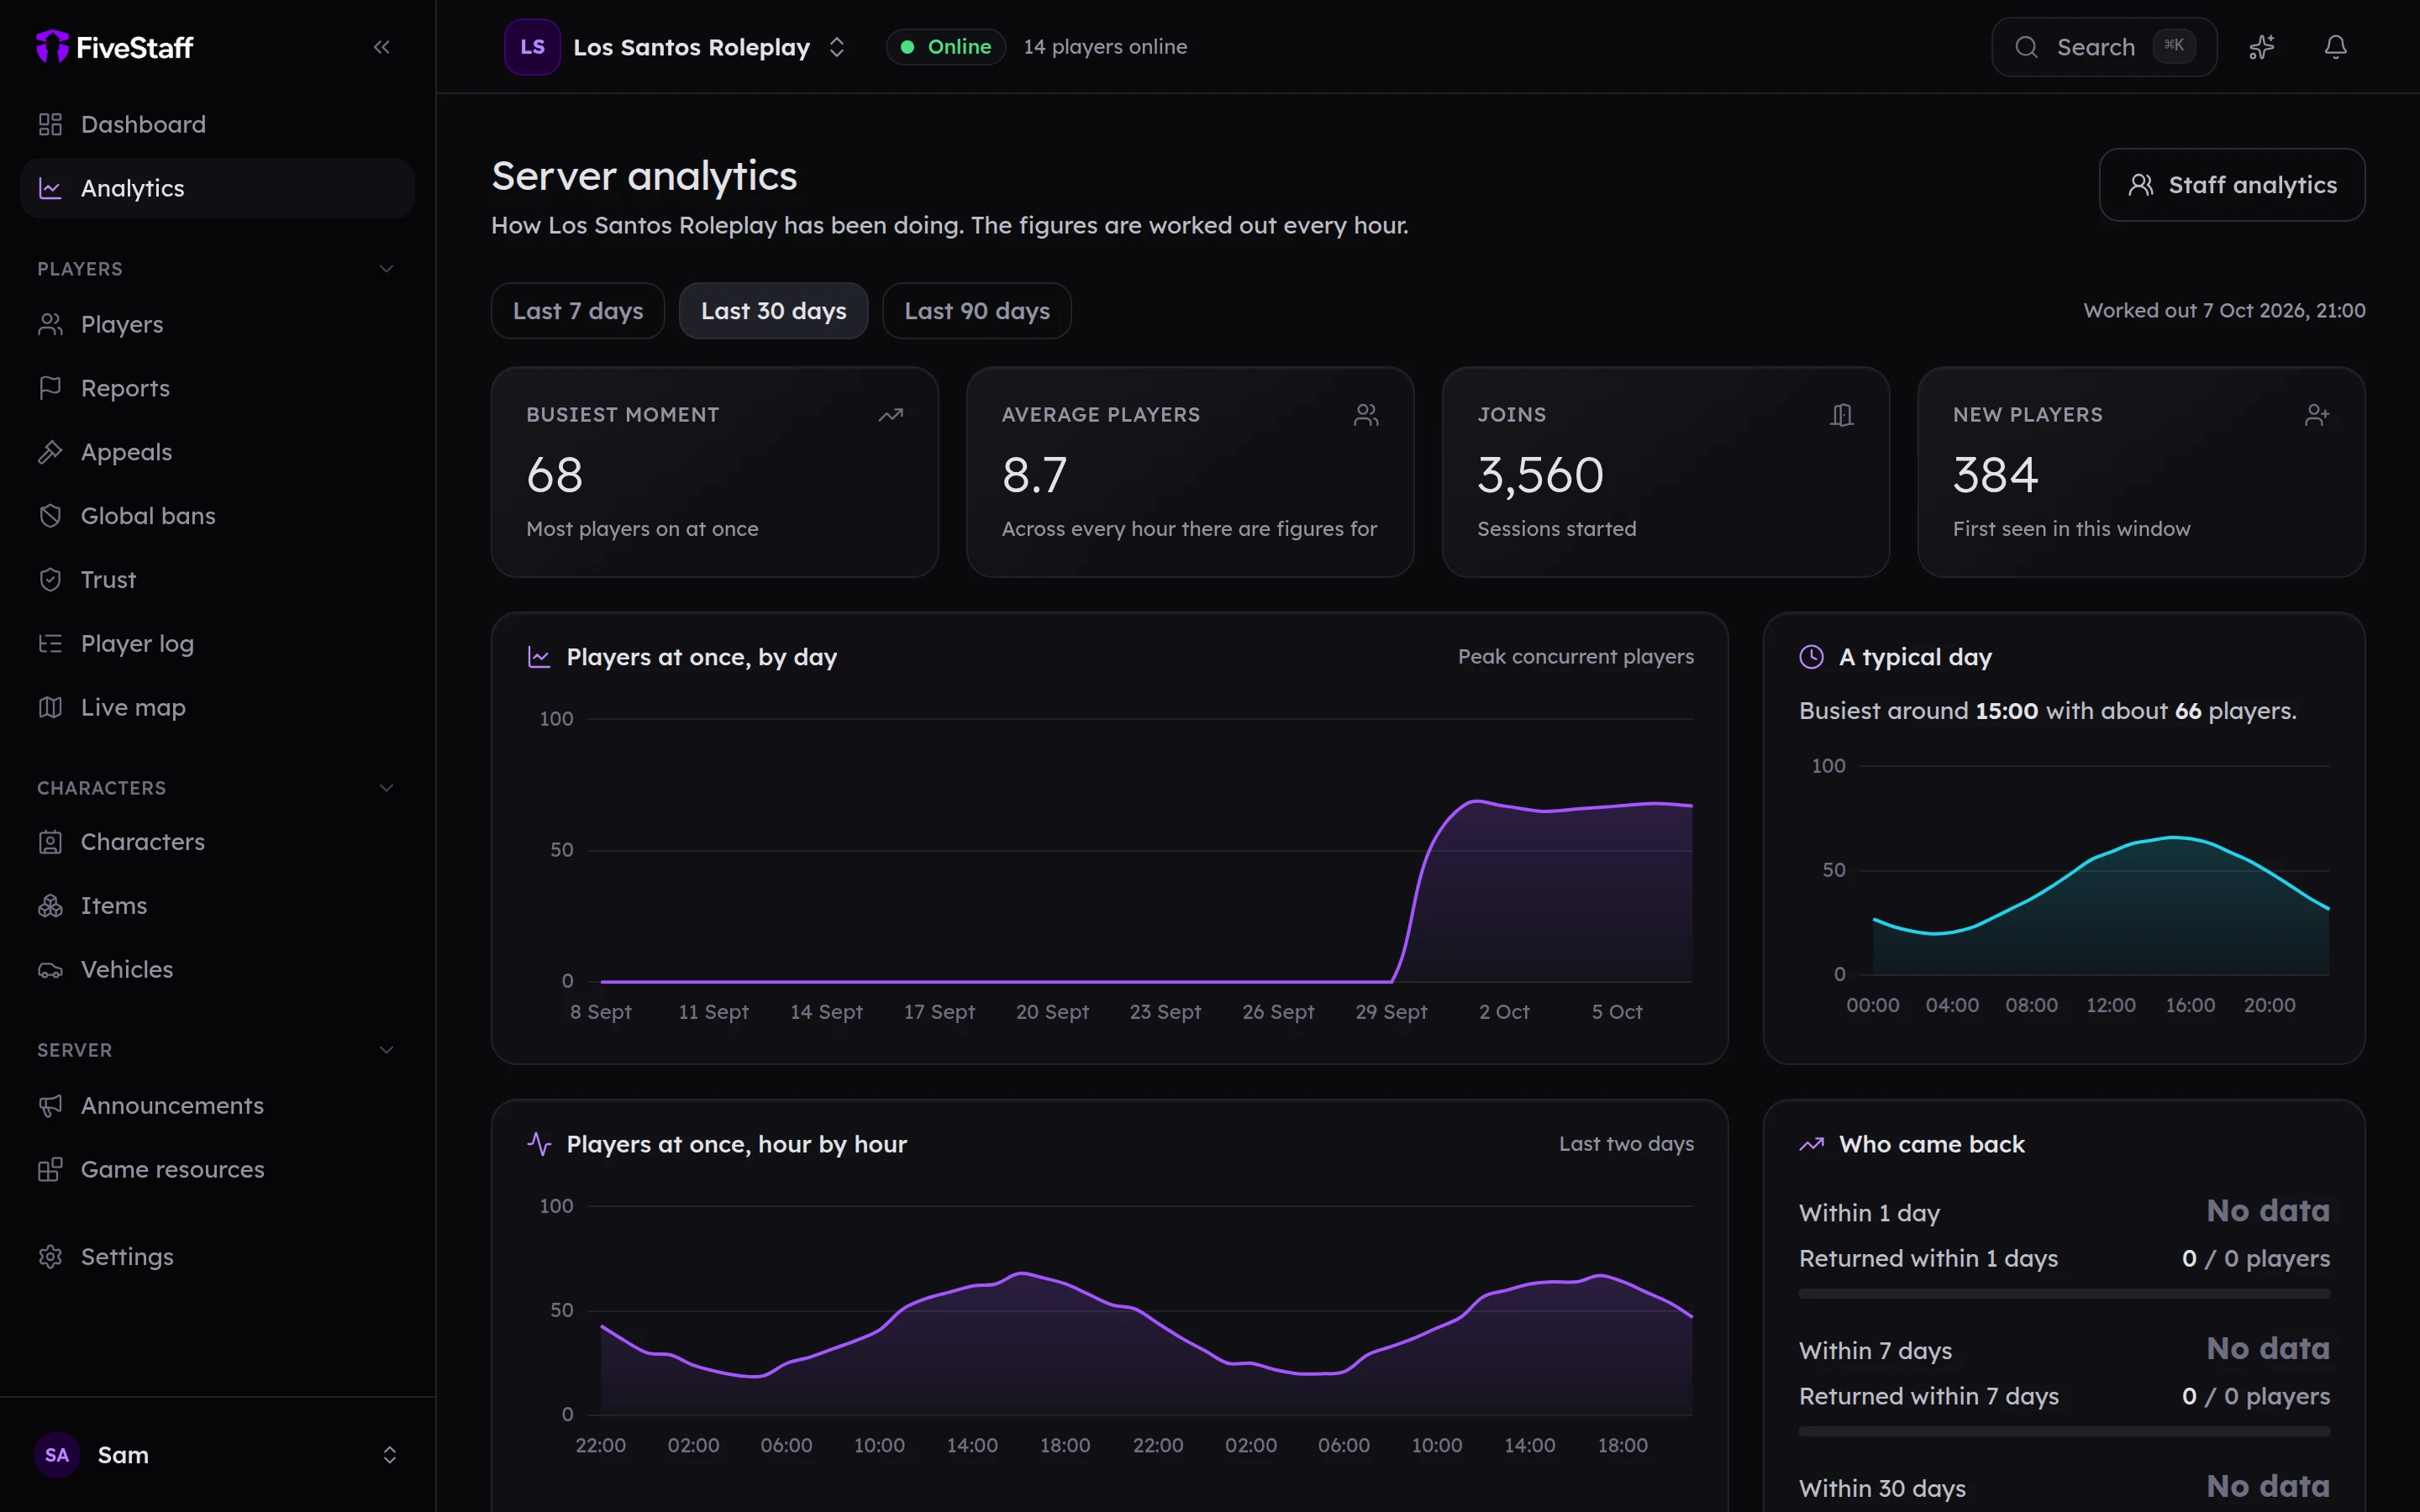
- Busiest moment: the most players on at once.
- Average players: across every hour in the window.
- Joins: how many times somebody connected.
- New players: people seen for the first time.
The charts show players by day, a typical day hour by hour, and the last two days. Who came back shows how many new players returned within a day, a week and a month.
Staff analytics#
Press Staff analytics at the top of the analytics page to see how your team is handling reports.
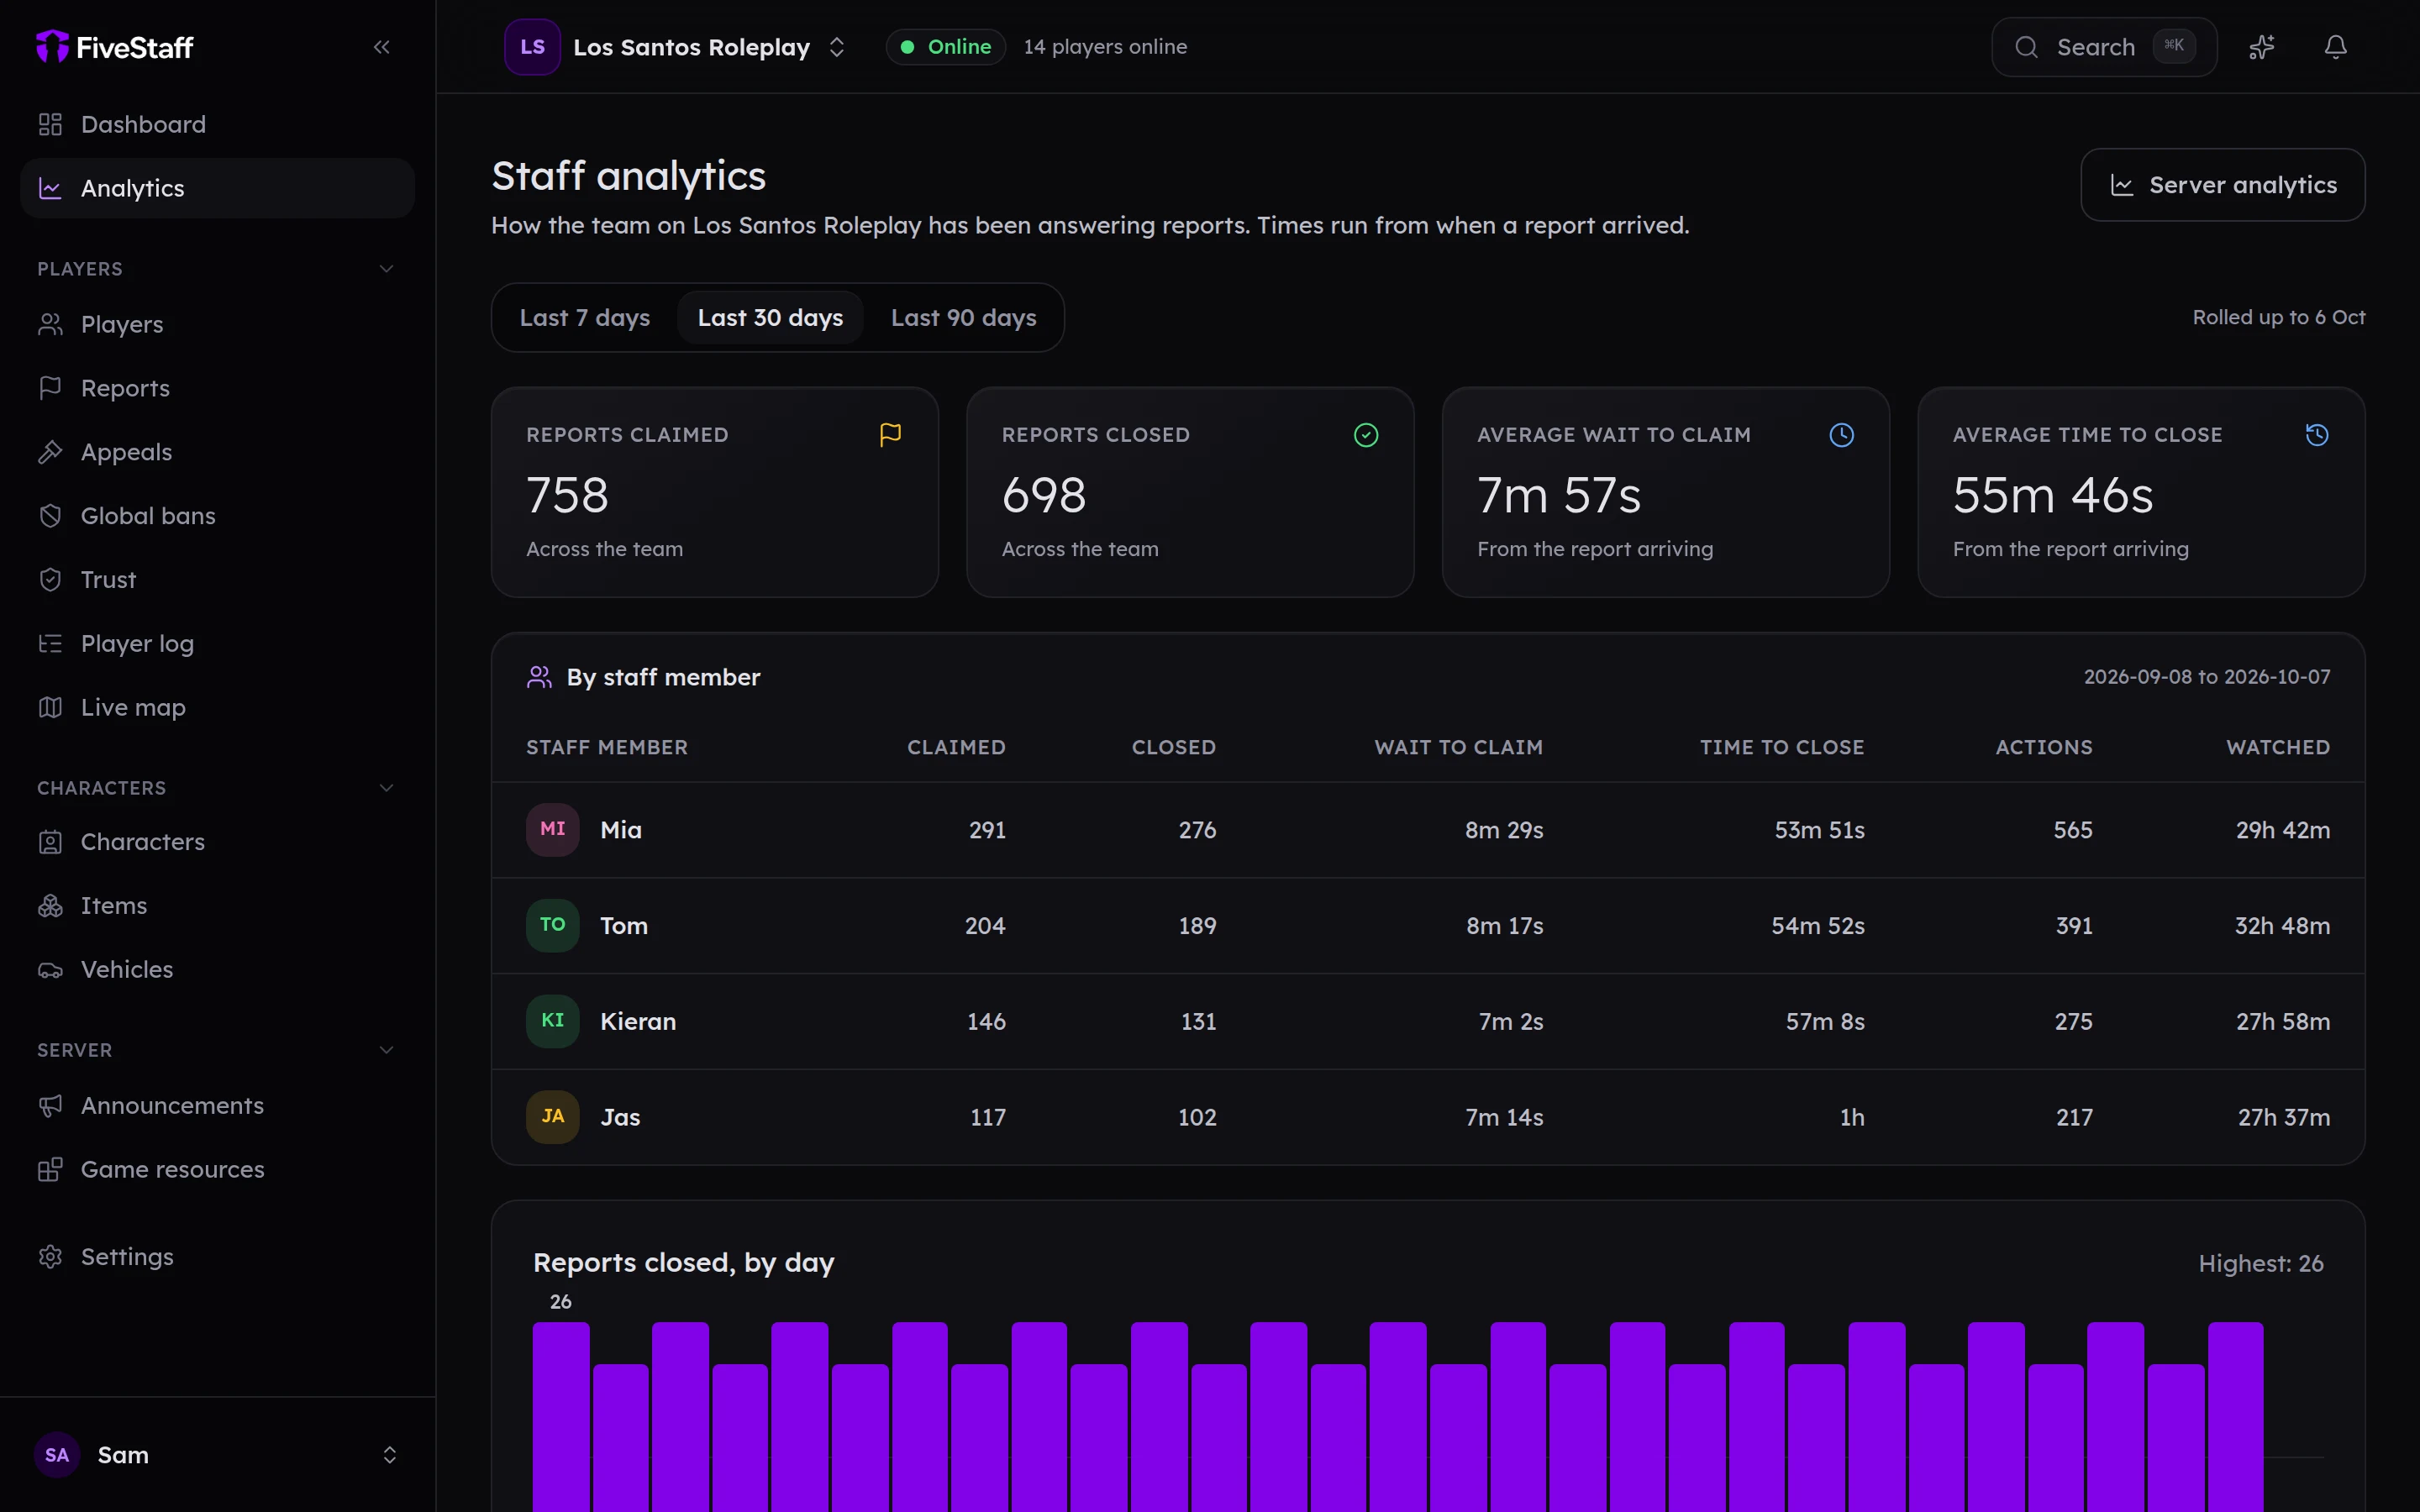
- Reports claimed and Reports closed.
- Average wait to claim: how long a report waited before somebody picked it up.
- Average time to close: from the report arriving to it being closed.
By staff member breaks these down per person, with how many actions they took and how long they spent watching players.
Each page needs its own permission: View server analytics and View staff analytics.